Comparing the number of new Python2 and Python3 packages on PyPi
Posted on Sun 08 January 2017 in Python
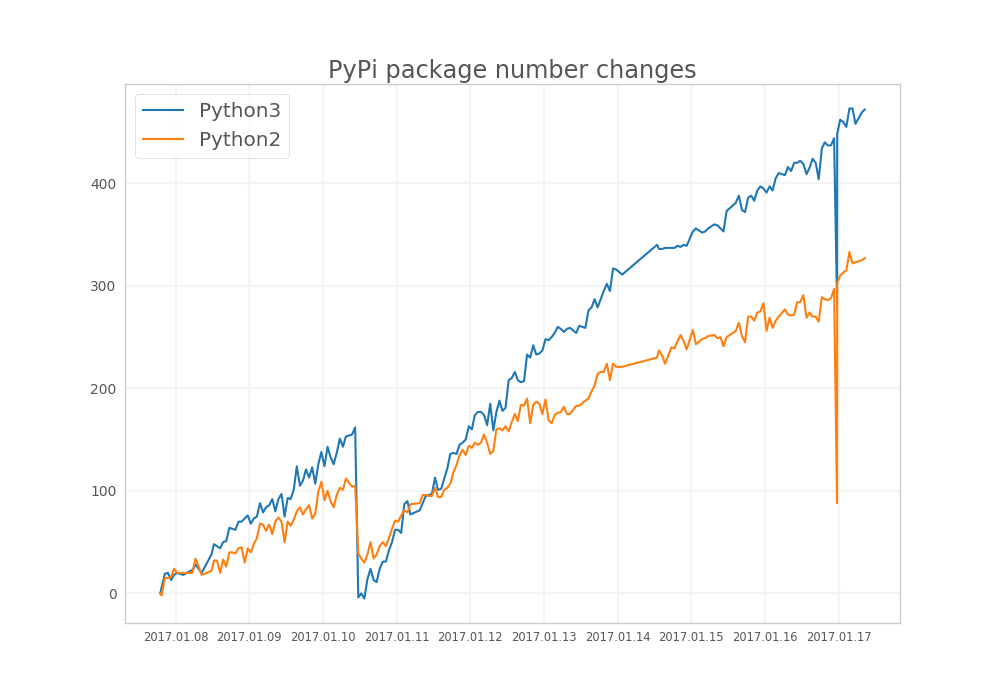
I didn't found information about the current activity around different Python versions. So, I decided to periodically collect the number of PyPI packages from the official site to get insight to the current popularity of Python2 vs. Python3.
Here are the results:

Technical details
The number of packages in PyPi categories are publicly available.
Data scraper script
from sys import stdout
from time import sleep, time
import requests
from lxml import html

PYPI_CATEGORIES_URL = 'https://pypi.python.org/pypi?%3Aaction=browse'
PY_VERSIONS_XPATH = '//*[text()="Programming Language :: Python"]/../ul[1]/li'


def fetch():
    while 1:
        resp = requests.get(PYPI_CATEGORIES_URL)
        dom = html.fromstring(resp.text.encode('utf-8'))
        stdout.write('timestamp: {}, '.format(int(time())))
        print(', '.join(': '.join(x.strip().replace(')', '').replace('(', '')
                                  for x in v.xpath('.//text()') if x.strip())
                        for v in dom.xpath(PY_VERSIONS_XPATH)))
        stdout.flush()
        sleep(120)


fetch()
Plotting the results
The chart was created with matplotlib. Custom configuration is available in my dotfiles repo.
from collections import defaultdict
from datetime import datetime
from sys import argv
import matplotlib.pyplot as plt
from matplotlib.dates import DateFormatter

date_formatter = DateFormatter('%Y.%m.%d\n%H:%M')

data = defaultdict(list)
base = {}
dates = []

tags = ['2', '2.6', '2.7', '3', '3.4', '3.5']

with open(argv[1]) as infile:
    for line in infile.readlines():
        cols = [x.split(': ') for x in line.strip().split(', ')]
        # sometimes PyPi gives empty response, skipping
        try:
            timestamp = int(cols[0][1])
            row_data = dict(x for x in cols[1:] if x[0] in tags)
        except:
            continue

        row_values = defaultdict(int)
        for col_name, col_value in row_data.items():
            c = col_name[0]
            col_value = int(col_value)
            if col_name not in base:
                base[col_name] = col_value

            row_values[c] += col_value-base[col_name]

        # skip lines with same data
        if data and all(data[x][-1] == row_values[x] for x in row_values):
            continue

        for c in row_values:
            data[c].append(row_values[c])
        dates.append(datetime.fromtimestamp(timestamp))


fig, ax = plt.subplots(1)

for py_version in data:
    d = data[py_version]
    plt.plot(dates, data[py_version], label='Python{}'.format(py_version))

plt.legend()
plt.gcf().axes[0].xaxis.set_major_formatter(date_formatter)
ax.set_title("PyPi package number changes")
fig.savefig('xy.png')